Within-domain understanding. Cross-domain dependencies. One connected operating context.
Local signals become a shared operating map. Connections alone do not create scale.
What the animation shows: The separate domain illustrations organize into one connected operating map. Signals move within local domains and across selected dependencies. This establishes a navigable foundation, not an operating improvement by itself.
020:12–0:28
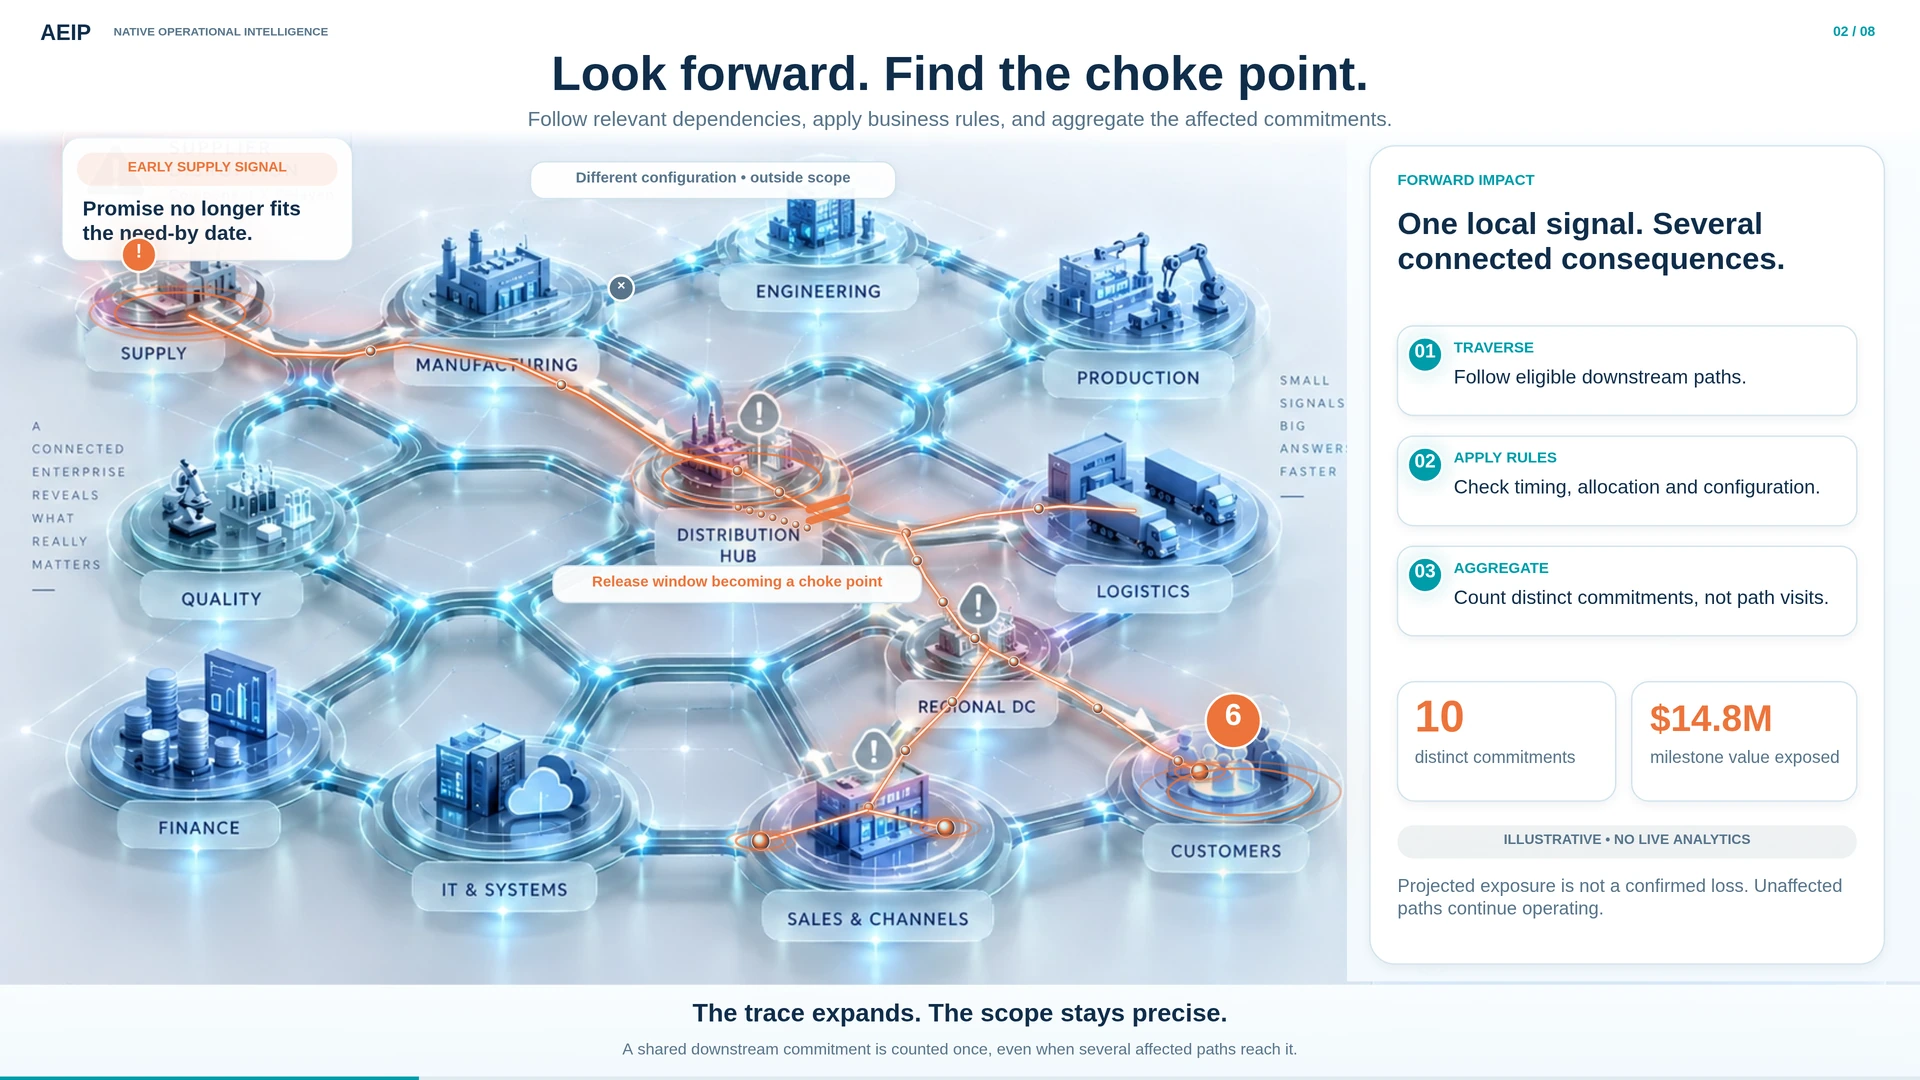
Look forward. Find the choke point.
Follow relevant dependencies, apply business rules, and aggregate the affected commitments.
A shared downstream commitment is counted once, even when several affected paths reach it.
What the animation shows: An illuminated forward trace branches from the supply-readiness signal through relevant timing, allocation and configuration paths. A release window becomes a shared choke point. Affected commitments aggregate; duplicate paths do not create duplicate commitments. Other paths remain outside the selected impact scope.
030:28–0:41
Act before the recovery window closes.
Consequence matters. So do timing, feasibility, and the impact an intervention can still avoid.
In this example, reserve the qualified release slot first; supply recovery has a longer decision window.
What the animation shows: The ranked action cards visibly reorder. In the authored scenario, the two-hour window for an eligible downstream release slot moves ahead of the larger exposure with a longer supply-recovery decision window. Feasibility and approvals are still required.
040:41–0:59
Recreate the past. Test the explanation.
Trace backward through relevant prior states—not backward through a frozen live enterprise.
Timing, scope and rule history support or challenge candidate explanations. Missing evidence stays unresolved.
What the animation shows: The selected investigation moves backward through reconstructed earlier states while live operations are kept distinct. Candidate paths narrow by timing, scope and rule evidence. Missing earlier supplier history remains an unresolved branch, not an eliminated explanation. The illustrated planning mismatch is a 14-day rule against applicable 28-day supplier terms.
050:59–1:12
Protect today. Change what caused the problem.
Compare options, name accountable owners, and verify the result of authorized action.
The scenario pairs an immediate release-slot reservation with an approved, scoped lead-time-rule correction.
What the animation shows: The decision view separates immediate recovery from a scoped planning correction. A release-slot reservation and a lead-time-rule correction have explicit review, ownership and verification. Correcting the planning mismatch does not establish every supplier cause.
061:12–1:23
The next plan starts with what was learned.
Execution informs planning. Approved parameters return to operations. Outcomes are checked again.
The next modeled cycle uses the reviewed rule. Reuse is conditional, and continued verification is required.
What the animation shows: Evidence and learning feed planning through the Operational Intelligence Hub. Approved parameters return to operations. The next modeled cycle is checked again, and the conditions and limits of reuse remain visible.
071:23–1:43
Scale output—not repeated firefighting.
The ambition: more delivered value, with reusable intelligence and less proportional coordination.
Illustrative five-to-100-aircraft progression. All coordination input indices are assumptions, not measured results.
What the animation shows: Individual aircraft arrive and the fleet rearranges as the counter increases from 5 to 10, 25, 50 and 100 per equal-length illustrated operating period. Time, money and resource indices rise on separate cards. These are authored coordination-input assumptions, not total production requirements or measured AEIP gains.
081:43–1:50
A stronger operating capability. A larger possibility.
See forward. Investigate backward. Act with authority. Carry validated learning into the next plan.
What the animation shows: The final view retains the 100-aircraft fleet, the Operational Intelligence Hub, the two forms of reuse, and the three intended enterprise outcomes. The visual is an ambition under stated assumptions—not a claim that one correction causes a twentyfold production increase.
Illustrative scaling ambition—not measured AEIP results. Input indices represent intelligence and coordination effort, not total production costs, labor, or capital. The 5-to-100 aircraft sequence is not an outcome attributed to a single correction.
Jump into the original animation ↓
Full scenario and scaling assumptions
This is an authored, silent visual explanation—not a live AEIP analytical engine or a customer-performance claim. All figures and events are illustrative.
One continuous story
Separate views become connected. A supply-readiness signal is traced forward through timing, eligibility and allocation dependencies to 12 distinct commitments and illustrative milestone exposure of $18.4 million. Several paths reach the same commitments; they are counted once. Unaffected paths remain outside the selected impact scope.
Prioritization does not mean biggest exposure first. In the authored example, a qualified downstream release slot closes in two hours; reserving it could protect six of the exposed commitments. Supply recovery has a longer 24-hour decision window. Feasibility, approval and evidence must still be established; these are illustrative priorities, not recommendations for a real operation.
The investigation reconstructs relevant earlier states and tests candidate explanations. Carrier timing and demand do not support the explanation in this example. Missing earlier supplier history remains unresolved rather than falsely eliminated. The illustrated supported planning cause is a 14-day planning parameter that was not updated for applicable 28-day supplier terms. That explains the scoped planning mismatch; it does not establish every supplier cause.
The scenario separates immediate recovery from recurrence reduction: reserve the eligible release slot, approve the applicable planning correction, and verify the subsequent outcome. The Hub moves evidence into planning, returns approved parameters to execution, and retains results and conditions for reuse. A corrected modeled condition is not a guarantee against future disruption.
Two different things are reusable
The platform's native intelligence capabilities can be configured for further operating questions. Validated operational knowledge may be reused where current context, evidence and authority support it. Neither the connections nor stored history alone establish automatic compounding.
Aircraft and input indices
Aircraft per illustrated period
Output index
Investigation hours
Intelligence / coordination spending
Coordination-team capacity
5
1.0×
1.0×
1.0×
1.0×
10
2.0×
1.3×
1.4×
1.2×
25
5.0×
1.65×
1.85×
1.5×
50
10.0×
2.0×
2.35×
1.8×
100
20.0×
2.6×
3.0×
2.2×
These are manually authored illustrative assumptions relative to the five-aircraft baseline, not measured or forecast AEIP effects. Equal-length operating periods are assumed. Input indices concern intelligence and coordination, not total factory labor, material cost, elapsed manufacturing time, capital expenditure or all enterprise resources. Physical capacity, investment, qualification, demand and approvals remain necessary. The example does not claim a single correction produces a 20-fold manufacturing gain.
Which constraint could limit your next stage of growth?
Bring one delivery, capacity, readiness or optimization question. Start with the decision, the evidence it needs, and what a useful evaluation would establish.